Performance & returns
IBviz offers multiple complementary ways to measure and understand portfolio returns. Each metric answers a different question; no single figure tells the full story. This article covers:
- Total P&L: realized, unrealized, and FX breakdown (in base currency)
- Time-weighted return (TWR): return independent of cash flow timing (%)
- Money-weighted return (MWR): actual return experienced by the investor (%)
- NAV-per-share return & VADI: daily performance index vs. benchmark, adjusted for capital flows (%)
- Periodical returns: daily, MTD, QTD, YTD, ITD, monthly heatmap (%)
- Rolling returns: 3, 6, and 12-month windows (%)
- Risk-adjusted returns: Sharpe, Sortino, Calmar (ratios)
- Net equity vs. net deposits: in base currency
- Returns at the strategy level
- Returns at the asset level
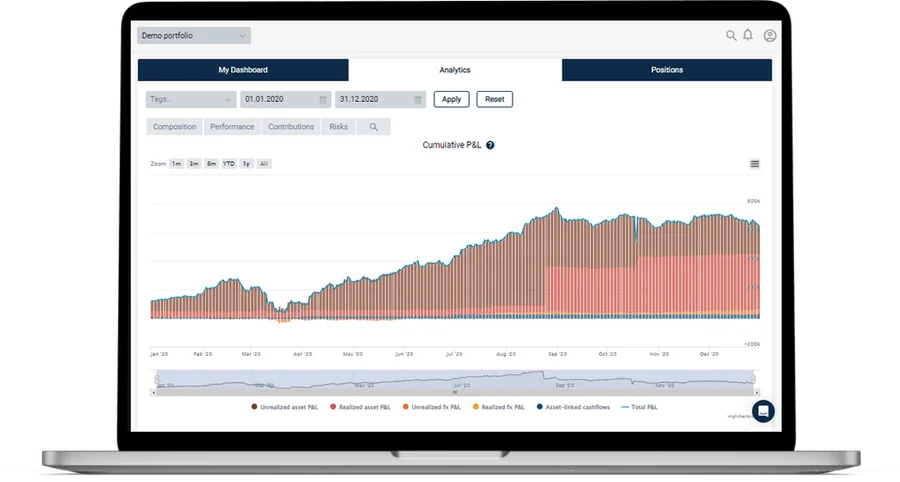
Total P&L
The most direct measure of how much money your portfolio has made or lost, expressed in your portfolio's base currency. IBviz breaks total P&L into its components:
- Realized P&L: gains and losses from positions you have fully or partially closed.
- Unrealized P&L: the mark-to-market gain or loss on positions still held.
- Price P&L vs. FX P&L: IBviz further splits each into the portion attributable to price movements and the portion attributable to foreign exchange fluctuations, particularly meaningful for multi-currency portfolios.
Time-weighted return (TWR)
Time-weighted return (TWR) measures how well investment decisions have performed, independent of when capital was added or withdrawn. It does this by breaking the portfolio's history into sub-periods separated by each cash flow event, computing a return for each sub-period, and then geometrically linking those returns together. The result isolates the effect of investment decisions from the effect of deposit and withdrawal timing, making TWR the standard method for evaluating and comparing portfolio managers.
Money-weighted return (MWR)
Money-weighted return (MWR), also known as the Internal Rate of Return (IRR), measures the actual return experienced by the investor, taking into account the size and timing of every deposit and withdrawal. Unlike TWR, MWR is directly influenced by when capital was added or removed: a large deposit made just before a strong market rally will push MWR above TWR, while a large deposit made just before a drawdown will drag it below.
This sensitivity to cash flow timing is precisely what makes MWR useful alongside TWR. If your MWR is significantly higher than your TWR, your capital allocation decisions (when you added and withdrew money) amplified your returns. If it is lower, those decisions detracted from what your investment strategy alone delivered. Comparing the two figures gives you a fuller picture of total portfolio outcomes.
One known limitation of MWR is the possibility of multiple solutions. Because MWR is derived as the rate that sets the net present value of all cash flows to zero, portfolios with alternating signs in their cash flow sequence (for example, a large deposit followed by a large withdrawal followed by another large deposit) can produce more than one mathematically valid rate. In such cases no single MWR figure unambiguously represents the portfolio's return, and the result should be interpreted with caution. This is an inherent constraint of the IRR formula rather than a data issue, and it is one reason why TWR and VADI remain the primary performance metrics for portfolios with frequent cash flows.
NAV-per-share return & VADI
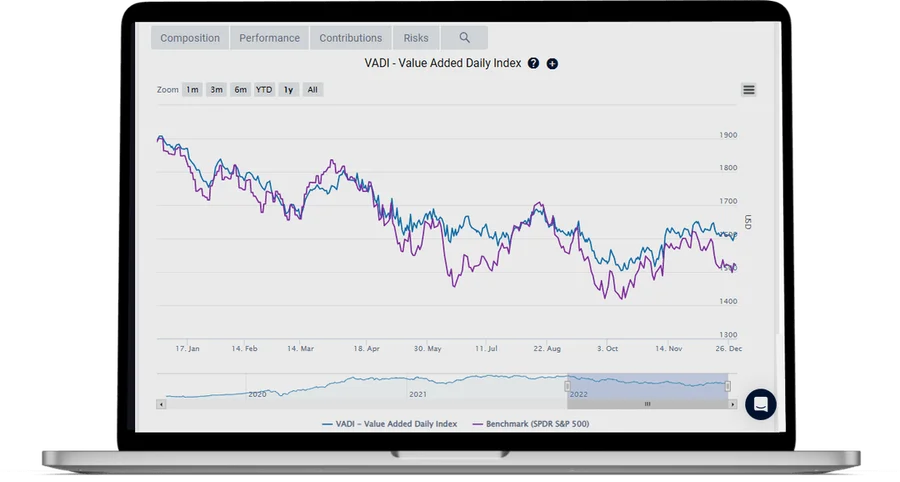
NAV-per-share is the most rigorous yet intuitive way to measure your portfolio return: your portfolio is treated like a fund with shares. When you deposit money, you buy new shares. When you withdraw, you sell shares. The share price itself moves only with your investment returns, never with how much money you put in or took out.
This solves the main weakness of both TWR and MWR. TWR gives you a single percentage that ignores the actual size of your capital at each point in time. MWR can become ambiguous when you have many deposits and withdrawals. NAV-per-share sidesteps both problems: it recalculates your performance every single day, accounting for each capital movement as it happens, and expresses the result as a continuous price curve from day one to today.
The practical benefit is direct, fair comparison. Because the curve reflects your personal history of deposits and withdrawals but is not distorted by them, you can lay it alongside the S&P 500, a bond index, or any other benchmark and immediately see whether your portfolio is ahead or behind, over any period you choose.
At IBKR and IBviz, this measure is called VADI (Value Added Daily Index). IBviz charts VADI against a benchmark of your choice (default: S&P 500 / SPY). See Compare your performance to a benchmark.
Periodical returns
IBviz lets you slice performance across standard calendar periods so you can quickly assess any stretch of time. All returns are expressed as a percentage:
- Daily return: the portfolio's P&L for the most recent trading day.
- MTD (Month-to-Date): return since the first trading day of the current month.
- QTD (Quarter-to-Date): return since the start of the current quarter.
- YTD (Year-to-Date): return since 1 January of the current year.
- ITD (Inception-to-Date): cumulative return since the portfolio's first transaction.
- Monthly returns heatmap: a calendar view of monthly returns that makes seasonal patterns and outlier months immediately visible.
Rolling returns
Rolling returns, expressed as a percentage, show the portfolio's performance over a fixed window (3 months, 6 months, or 12 months) computed at every point in time. Unlike point-to-point returns, rolling returns reveal how consistent the portfolio has been: a high average return with wide swings in rolling performance signals much more volatility than a portfolio with a similar average but tight rolling bands. IBviz charts all three windows so you can compare consistency across timeframes.
Risk-adjusted returns
Raw returns tell you what you made; risk-adjusted returns tell you what you made per unit of risk taken. These are expressed as dimensionless ratios (not percentages). IBviz computes three widely used ratios:
- Sharpe ratio: excess return (above the risk-free rate) divided by the portfolio's total volatility. The most common risk-adjusted metric, it penalizes both upside and downside volatility equally.
- Sortino ratio: like the Sharpe, but only penalizes downside volatility. A higher Sortino than Sharpe means the portfolio's volatility is predominantly on the upside, which is generally desirable.
- Calmar ratio: annualized return divided by maximum drawdown. A useful way to assess whether the returns justify the worst loss the portfolio has experienced.
Net equity vs. net deposits
This chart compares the total market value of your portfolio (net equity) against the cumulative net capital you have injected (net deposits = deposits minus withdrawals), both expressed in your portfolio's base currency. The gap between the two lines is your total absolute P&L at a glance, making it easy to see whether portfolio growth is coming from investment returns or from fresh capital injections.
Returns at the strategy level
If you invest across multiple sub-strategies (for example, separating equity longs, fixed income, and options), IBviz lets you group positions into strategies and compute all of the above metrics independently for each group. This makes it possible to attribute overall portfolio performance to individual strategies and identify which ones are driving or dragging returns.
Strategies are created under Strategies in the menu. Once set up, all analytics dashboards can be filtered to a single strategy.
Returns at the asset level
Every position in your portfolio has its own analytics page showing:
- Realized and unrealized P&L, split between price and FX components.
- The asset's price history overlaid with your entry and exit points.
- Dividends, interest, and transaction fees attributed to that position.
To access asset-level analytics, go to Assets → My Investments and click any asset name. See also View asset-specific analytics.